Release Gallery
Feature releases and screenshots
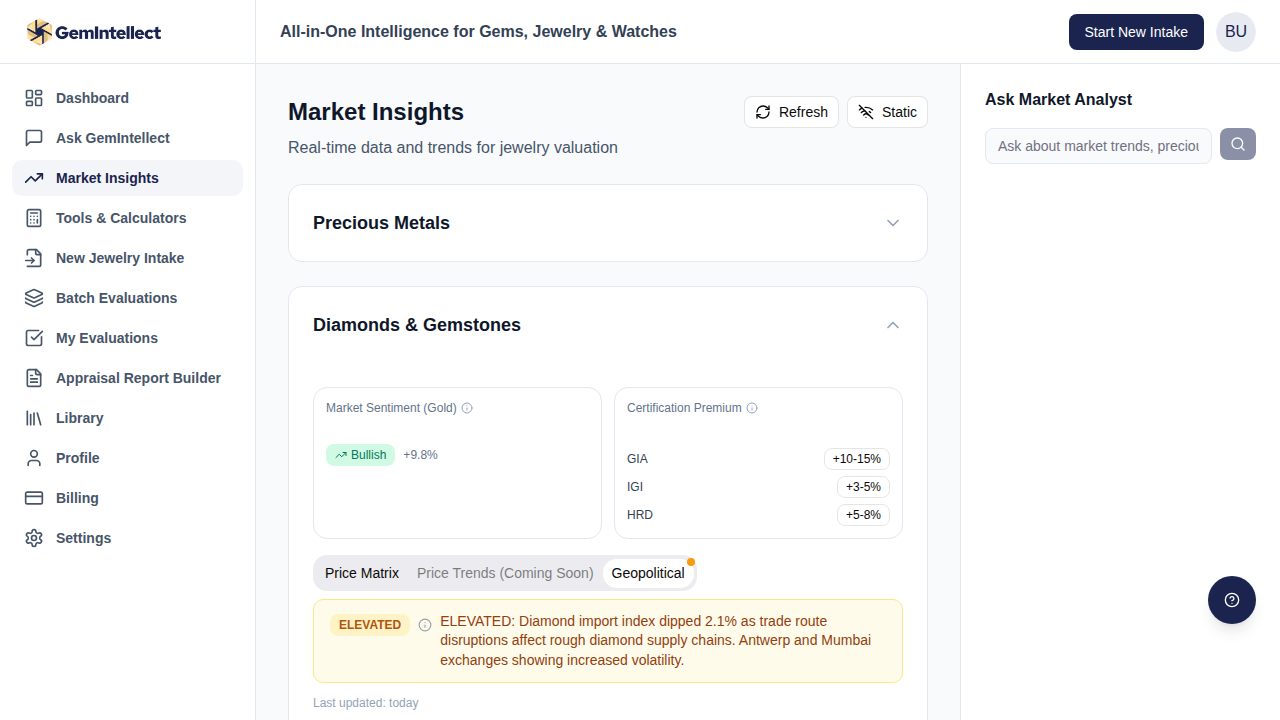
Geopolitical Market Insights
GPR Index Correlation with Precious Metals & Diamonds
2026-03-27
v1.0
11 screenshots